Healthcare will be effective and sustainable only when regional service levels are matched to the needs of residents living in the region.
Research Methodology
Secondary Research
“Healthcare will be effective and sustainable only when regional service levels are matched to the needs of residents living in the region.” With that principle as our north star, RHI worked for 18 months on a uniquely map-based data analysis designed to understand the how and where of rural healthcare delivery. Over the course of countless hours, we analyzed 70 gigabytes of data, including 1.6 million inpatient encounters and 47.2 million outpatient encounters.
More than sheer scope, however, it was the geographic framing that made this project unique. If healthcare delivery is like a balloon that changes its shape as needs and resources shift, then a large part of our research imperative was to understand how much the system can be squeezed before there is a rupture.
Our quantitative research can be understood as four main phases, with phase four serving as an overlay considering how the larger forces of healthcare transformation efforts might fundamentally alter the map.
Phase I – The Lay of the Land
We started with a deceptively simple question: “What is rural”? Surprisingly, there is no single, commonly accepted answer. Federal agencies alone employ more than two dozen definitions for regulatory, statistical, and fiscal purposes. States like North Carolina also have multiple definitions, which vary by program or objective. The NC Department of Transportation, for instance, uses a different definition than the Department of Health and Human Services.
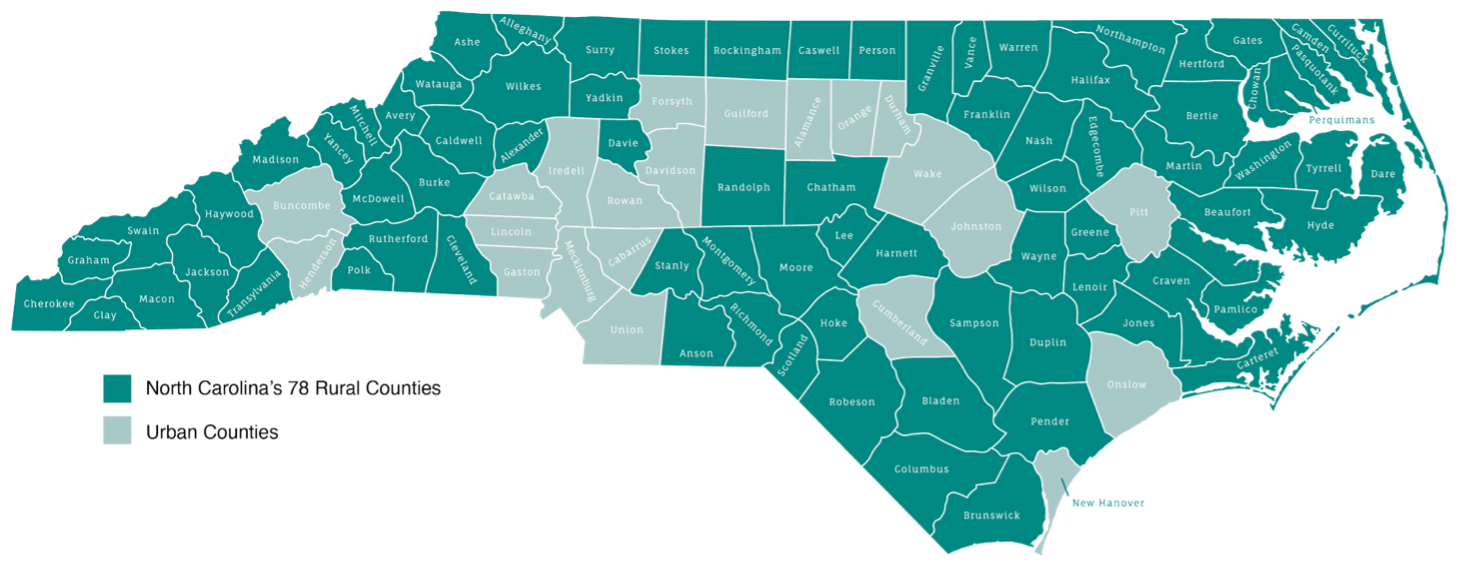
For the Rural Sustainability Plan, we defined rural counties as those with a population density of fewer than 250 residents per square mile – the same definition used by the Census Bureau. Our map, similar to the one from the NC Rural Center, features 78 rural counties with a population of 3.75 million. By this measure, North Carolina is the second-most rural state in the country, following Texas.
Next, we analyzed how rural residents naturally flow across county lines for work, commerce, and social life. Those inter-county connections are nicely captured by North Carolina’s eight existing Prosperity Zones, which we adapted only slightly when the data showed that healthcare behaved differently from other parts of the regional economy. In the Southeast region, for instance, Novant New Hanover in Wilmington draws heavily from Columbus County, so we shifted Columbus County to the Southeast region to reflect that reality. In our Findings, which begin on page 10, these regions serve as our unit of analysis rather than individual counties.
Phase II – The Level of Need
With a rural map finalized, we next turned to the Robert Wood Johnson Foundation and its County Health Rankings, a well-established tool that uses health factors (like obesity or diabetes) and health outcomes (like cancer mortality or life expectancy) to score and stratify every county in America for easier comparison. Along with the usual datapoints, we added measures of healthcare access (broadband penetration and uninsured rates, for instance) plus five “foundational” measures including a county’s growth rate, diversity index, and median age.
By scoring all 78 rural counties on 46 unique variables, we were able to sort them into cohorts representing their overall healthcare outlook or level of need. These cohorts were key to shaping our Blueprint because lower-ranking counties have less margin for error in dealing with a sudden closure or loss of essential services. For instance, in general, a struggling hospital in a Cohort 1 county would create less immediate concern than the same hospital in a Cohort 4 county.
While County Health Rankings are based on the needs of individuals, we added another layer of research focused on the need for institutions. This “essentiality analysis,” as developed by the New Jersey Commission on Rationalizing Health Resources and adapted by RHI, looks at community characteristics, hospital characteristics, and geographic characteristics to determine which hospitals must be preserved at all costs. In other words, essentiality is not a judgment of the hospital itself, but rather an analysis of overall community need and the larger impact of any closure. This analysis recognizes that hospitals are only one piece of the healthcare continuum, but other key providers – physicians and ambulance services – usually require a nearby hospital in order to operate sustainably.
If a hospital closes, patients and providers in most counties could shift to another location with some degree of inconvenience but few life-or-death implications. But in truly “essential” cases, relatively convenient alternatives do not exist, and the closure of a local hospital would cause widespread, existential damage across the healthcare continuum.
Across all of rural North Carolina, we found only 15 hospitals that met this definition of essentiality. Those hospitals were flagged for special attention in developing the Blueprint.
Phase III – The Distribution of Resources
What healthcare services are currently available in North Carolina’s rural communities, and how do those services match the needs of the population? Without that baseline understanding, we have no way of tracking gains and losses over time. Hospital closures may grab the headlines, but what about ambulances or emergency rooms? Systems thinking tells us that myriad services contribute to the overall health of a community, and a breakdown in one area can overtax other parts of the system.
Surprisingly enough, we were unable to find a comprehensive inventory of the key, interrelated healthcare services available in rural North Carolina. So, using a variety of sources, including cost reports and license renewal applications, we quantified the following services and provider resources in 78 rural counties:
Facility-Based Resources
- Acute care beds
- Behavioral health access points
- Inpatient Psychiatric (Acute Care Hospitals, Behavioral Health Hospitals, and State-owned Psychiatric Hospitals)
- Community Crisis Centers (Walk-in and Facility-based)
- Behavioral Health Urgent Cares
- Federally Qualified Health Centers with Behavioral Health Services
- Emergency departments
- Emergency Medical Services
- Operating rooms
- Magnetic Resonance Imaging (MRI)
- Cardiac catheterization
- Oncology treatment (infusion and radiation therapy)
- Obstetric delivery services
Medical Specialists
- Allergy/Immunology
- Cardiology
- Dermatology
- Endocrinology
- Gastroenterology
- Infectious disease
- Nephrology
- Neurology
- Occupational medicine
- Hematology/Oncology
- Physical medicine
- Psychiatry
- Pulmonology
- Radiation therapy
- Rheumatology
Surgical Specialists
- General surgery
- Gynecology
- Neurosurgery
- Ophthalmology
- Orthopedics
- Otolaryngology
- Plastic surgery
- CV surgery
- Thoracic surgery
- Urology
- Vascular surgery
Primary Care Specialists
- Family practice
- Internal medicine
- Ob/Gyn
Advanced Practice Providers
- Physician assistants
- Nurse practitioners
Perhaps the biggest single contribution of our quantitative research process was creating this statewide, county-by-county inventory of key healthcare resources – an effort we view as foundational to the Blueprint.
Phase IV – Healthcare Utilization Analysis and Transformation Modeling
The heart of our Blueprint development involved a comprehensive analysis of historical healthcare utilization patterns and future projections, followed by sophisticated optimization modeling to determine the ideal mix and distribution of healthcare facilities and services.
Historical Utilization Analysis
Using North Carolina’s Healthcare Information and Data Initiative (HIDI) database, we analyzed healthcare utilization data spanning multiple years. This analysis included over 1.6 million inpatient encounters and 47.2 million outpatient encounters across all North Carolina counties to understand where rural residents currently receive care, as well as their patterns of care-seeking across county and regional boundaries.
Key utilization metrics analyzed from HIDI data included:
- Acute care admissions and patient days by service line
- Emergency department visits and acuity levels
- Outpatient surgery volumes
Additional utilization data were gathered from multiple sources including hospital cost reports, state licensure databases, and provider directories to capture:
- Major imaging utilization (MRI, CT, cardiac catheterization)
- Post-acute care utilization patterns
- Emergency Medical Services (EMS) transport patterns
- Behavioral health service capacity and access points
We estimated expected patient visits by specialty, including primary care, to understand patient demand. This visit-based demand was then converted to provider need by applying assumptions around individual provider capacity and productivity. This provider-level analysis was essential for understanding the full spectrum of healthcare delivery in rural communities.
All of this analysis was critical because rural residents frequently travel outside their home county for care, making county-level planning inadequate. By understanding actual utilization flows, we could identify the true service areas and catchment patterns that define rural healthcare markets.
Future Utilization Projections and Transformation Modeling
We developed two parallel projection methodologies to forecast future healthcare demand:
Traditional Projections: Based on historical utilization trends adjusted for demographic changes, population growth/decline, and aging patterns. These five-year projections used established planning ratios and industry benchmarks to estimate future service needs.
Transformation Model: A proprietary model that accounts for anticipated changes in healthcare delivery, payment models, and consumer preferences. This model incorporates the shift toward value-based care, increased emphasis on preventive services, and the movement of care from inpatient to outpatient settings. The transformation model proved particularly valuable in rural settings where healthcare change may occur more gradually but with significant long-term implications.
Ultimately, however, transformational models played only a minor role in the Blueprint because rural healthcare needs a sustainable solution now, not 10 years from now. Accordingly, the Blueprint seeks to balance healthcare needs and resources under today’s market conditions, without adding expensive infrastructure that will become unsustainable in the future. As an example, when suggesting a new regional referral center, we ran transformational models to ensure that longer-term healthcare trends would not jeopardize its financial sustainability a decade in the future.
Optimization Modeling for Facility Mix and Distribution
Using both historical patterns and future projections, we developed optimization models to determine the ideal configuration of healthcare facilities across each of the 22 rural regions. This modeling process balanced the three critical factors of proximity, complexity, and stability that are detailed throughout this report.
The optimization process involved iterative modeling to test different scenarios and calculated accessibility scores based on drive time targets, utilization-to-capacity ratios, and financial sustainability indicators. While it is not possible to guarantee financial sustainability for any individual facility, we validated our modeling parameters by testing them against existing facilities with volumes, demographics, and socioeconomic factors similar to North Carolina communities. This validation confirmed that our sustainability assumptions were achievable in multiple real-world circumstances, though individual facility success will always depend on local execution and market dynamics. This quantitative analysis formed the foundation for our three-part scoring system (current state, current trajectory, and Blueprint implementation) used throughout the regional recommendations.
Integration with Qualitative Research
Throughout the utilization analysis and optimization modeling, we maintained close coordination with our qualitative research to ensure that our quantitative findings aligned with community needs and stakeholder perspectives identified through listening sessions and surveys. This integration was essential for validating our assumptions about acceptable drive times, community preferences, and the feasibility of recommended facility configurations.
Primary Research
To fully understand the patterns, trends, and relationships of the dynamic rural healthcare environment in North Carolina, it was important that we considered the experiences and insights of residents living and working in rural communities. That’s why in addition to gathering and analyzing quantitative data to understand existing healthcare resources and outcomes, we also gathered feedback from North Carolina residents. The numbers tell one story – was it confirmed by the lived experiences of those living in rural communities?
Phase I – Listening Sessions
To answer this question, we first conducted listening sessions in 12 counties across the state. Counties were selected to be geographically representative and inclusive of the Cohorts (with Cohort 1 having the best health outcomes and Cohort 4 having the worst health outcomes). For our 4 in-person sessions, we hosted one in each cohort. For our 8 virtual sessions, we hosted at least one in each cohort.
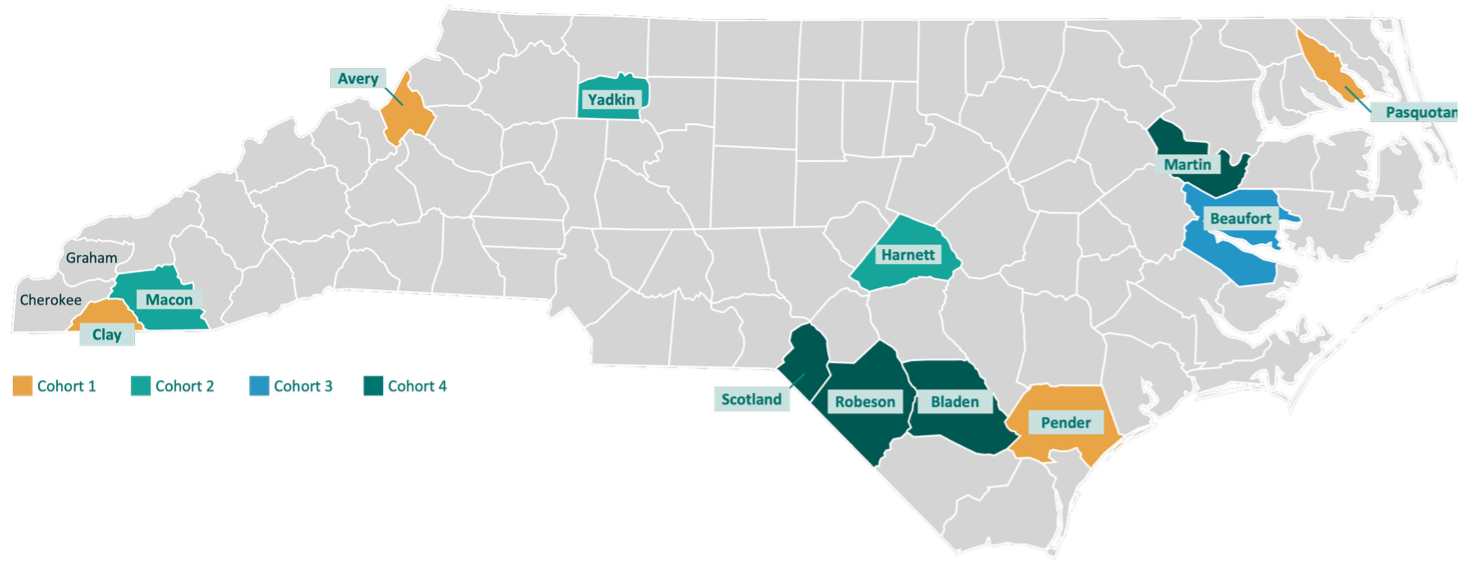
| County | Cohort | Virtual/In-Person |
| Avery | C1 | In-person |
| Beaufort | C3 | Virtual |
| Bladen | C4 | In-person |
| Clay *also attended by representatives from Cherokee and Graham counties |
C1 | In-person |
| Harnett | C2 | In-person |
| Macon | C2 | Virtual |
| Martin | C4 | Virtual |
| Pasquotank | C1 | Virtual |
| Pender | C1 | Virtual |
| Robeson | C4 | Virtual |
| Scotland | C4 | Virtual |
| Yadkin | C2 | Virtual |
Our goal for each listening session was to capture the unique perspectives of people who understand healthcare in the area and who represent their communities. To do this, we began by identifying a local champion who helped us create an invitation list. Invitations to participate in a session were then sent to dozens of local county-level leaders and community advocates from businesses, faith-based organizations, chambers of commerce, civic organizations, nonprofit organizations, state and local government, etc. Ultimately each session had between 7-15 participants.
Often, participants were involved in healthcare in some capacity, but not directly with any one hospital. This was intentional. Though a few hospital representatives did participate, we wanted the listening sessions to be focused on the holistic experience of healthcare in the local community, instead of centered around one facility. To that end, the questions posed were designed to uncover a comprehensive picture of rural healthcare in each county. Questions included:
- What are the biggest issues or concerns your local community members are facing today?
- Describe the experience of receiving healthcare in the region – including positive and negative aspects.
- What are the biggest barriers that prevent friends and neighbors from accessing the care they need?
- If you could wave a magic wand, what would you change to ensure your community gets the care it needs?
Phase II – Statewide Survey
To further expand on qualitative insights gained during the listening sessions, we then conducted a statewide quantitative survey to measure the public’s perception of healthcare among a representative sample of residents from rural communities across North Carolina. The survey tested the following topics:
- Overall satisfaction with and opinions about local healthcare
- Perceptions of and experience with access to healthcare services
- Preferences around distances to healthcare services, and willingness to travel for care.
- Perspectives on the availability of healthcare information and resources to navigate the care continuum.
Survey questions were developed using themes identified throughout the listening sessions and our secondary research. In addition, health data and health planning standards informed the design of survey questions related to current access to care and how far one is willing to travel for different types of care, including primary, specialty, emergency, behavioral health services, maternal care and oncology.
Importantly, the survey not only helped us better understand how rural North Carolinians think about and interact with healthcare services, but also pressure test how they felt about some of our secondary research findings. The total sample size included 1,612 adults across the 78 rural counties in North Carolina. The margin of error was +/- 3.45%.
The sampling design was based on geographic representation and population size of each county, leading to a demographically representative sample that reflects the makeup of the state’s rural community. Survey participants were contacted via live calls to landlines and cell phones and SMS texting to cell phones. A split sample design was utilized to minimize survey length for respondents and encourage high completion rates. The first set of questions was asked among 808 residents of North Carolina’s rural counties, with the second collecting responses from 804 people using the same demographic and geographic representation.
Conducting primary research ultimately ensured a dynamic, grassroots approach to our data analysis, allowing us to have meaningful engagement with those who not only experience rural healthcare themselves, but who are oftentimes deeply connected to the healthcare experiences of others.